
My Smart Scale Says I’m an Athlete—But Are the Numbers Telling the Truth?
My smart scale has apparently made a decision about me: I am an athlete. It displays 169.8 pounds, 12.8% body fat, 140.6 pounds of muscle mass, 56.3% skeletal muscle, and a metabolic age of 35. Meanwhile, my fitness tracker reports more than 11,000 steps per day, a rising cardio load, and a resting heart rate of 66 beats per minute. Put everything together, and the dashboard paints a flattering picture of a lean, highly active person whose body is operating like a well-maintained machine.
There is evidence behind that picture. I exercise regularly, walk far more than the minimum needed to avoid being sedentary, and have recently been working on improving my three-mile running pace. My cardio load increased 61% compared with the previous quarter, and I averaged 766 cardio-load points per week over the displayed period. Those are not the statistics of someone who never leaves the couch.
The mystery is how much further we can take the conclusion. Does a smart scale actually know that I am an athlete, or did I select a setting that instructed it to interpret me as one? Are 140.6 pounds of muscle, 7.4 pounds of bone, and 19.9% protein separate discoveries—or different outputs from the same algorithm? The deeper I looked, the more the dashboard began to resemble a mixture of real measurements, useful estimates, and numbers that are much more fragile than they appear.
What a Smart Fitness Dashboard Actually Measures
A smart scale usually relies on bioelectrical impedance analysis, commonly called BIA. When you stand barefoot on the electrodes, the scale sends a safe, extremely weak electrical current through part of your body and measures the resistance. Water-rich tissue conducts electricity differently from fat, so the scale combines that resistance with your weight, height, age, sex, and selected activity mode. It then uses proprietary equations to estimate the rest of your body composition.
The important word is “estimate.” The scale directly measures weight and electrical impedance, but it does not separately scan every pound of fat, muscle, bone, water, and protein. It certainly does not perform a miniature MRI or DEXA scan through the soles of your feet. Most of the impressive-looking dashboard is a mathematical interpretation of a surprisingly small amount of raw information.
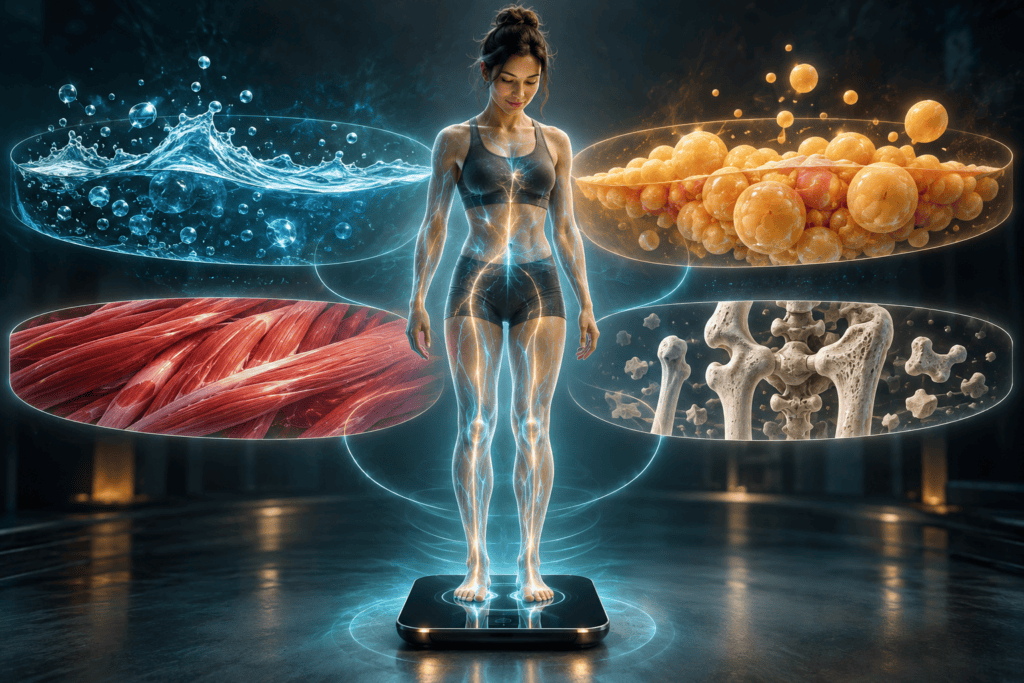


My data can be divided into four useful groups:
- Body size and composition: 169.8 pounds, a BMI of 23.8, 12.8% body fat, 148.2 pounds of fat-free mass, 140.6 pounds of muscle mass, 56.3% skeletal muscle, 7.4 pounds of bone mass, and a visceral-fat rating of 6.
- Hydration and metabolism estimates: 63% body water, 19.9% protein, an estimated basal metabolic rate of 1,821 calories, and a metabolic age of 35.
- Movement and cardiovascular data: an average of 11,089 steps per day, 21 days above an 8,000-step goal, 370,796 total steps, a resting heart rate of 66 beats per minute, and a cardio load that increased 61%.
- Sleep and recovery data: 7 hours and 28 minutes of sleep, a sleep score of 76, one hour awake, 16 minutes of restlessness, 1 hour and 12 minutes of REM sleep, 5 hours and 25 minutes of light sleep, and 51 minutes of deep sleep.
Viewed together, these numbers contain real information. The danger begins when we treat every number as equally reliable or assume that a decimal point means laboratory accuracy. Weight, step counts, heart rate, sleep duration, body-fat percentage, and metabolic age are not all measured with the same level of confidence. A useful interpretation begins by separating the stronger signals from the weaker ones.
Why Fitness Numbers Are So Convincing
Fitness technology is fascinating because it turns an ordinary day into a story. Walking becomes 11,089 steps, recovery becomes a score of 76, and an invisible physiological concept becomes precisely 140.6 pounds of muscle. Instead of merely feeling active, tired, or well-rested, we receive a dashboard that appears to explain why. The numbers feel objective, personal, and difficult to argue with.
Precision can create an illusion of certainty, however. A reading of 12.8% body fat feels more authoritative than “probably somewhere in the lean range,” even if the second statement is more honest. The app may show tenths of a percentage point because software can calculate them, not because the scale can truly distinguish 12.8% from 13.8%. The display’s precision and the measurement’s accuracy are two different things.
There is also a psychological reward built into athlete mode. Being classified as an athlete reinforces the idea that the workouts, miles, and daily movement are paying off. That motivation has value, but it can also discourage skepticism when the result is flattering. We are naturally more inclined to interrogate a bad number than a number that tells us we are lean, muscular, and biologically young.
What My Body-Composition Numbers Really Mean
Weight and BMI: The Strongest Starting Point
The most trustworthy smart-scale number is usually body weight. My reading of 169.8 pounds is likely reasonably close to reality if the scale is sitting on a hard, level surface and functioning properly. Day-to-day changes can still reflect hydration, food, sodium, glycogen, and bathroom timing, but the scale is genuinely measuring the force placed on it. A seven-day average is therefore more informative than celebrating or worrying about a single morning.
A BMI of 23.8 falls within the conventional “healthy weight” category for adults. That is reassuring as a broad screening result, but BMI does not know whether the weight comes from muscle, fat, bone, or a combination of all three. It cannot declare someone athletic, and it can misclassify unusually muscular people. In this case, it simply says that weight is proportionate to the height entered in the profile.
Body Fat, Fat-Free Mass, and Muscle Mass
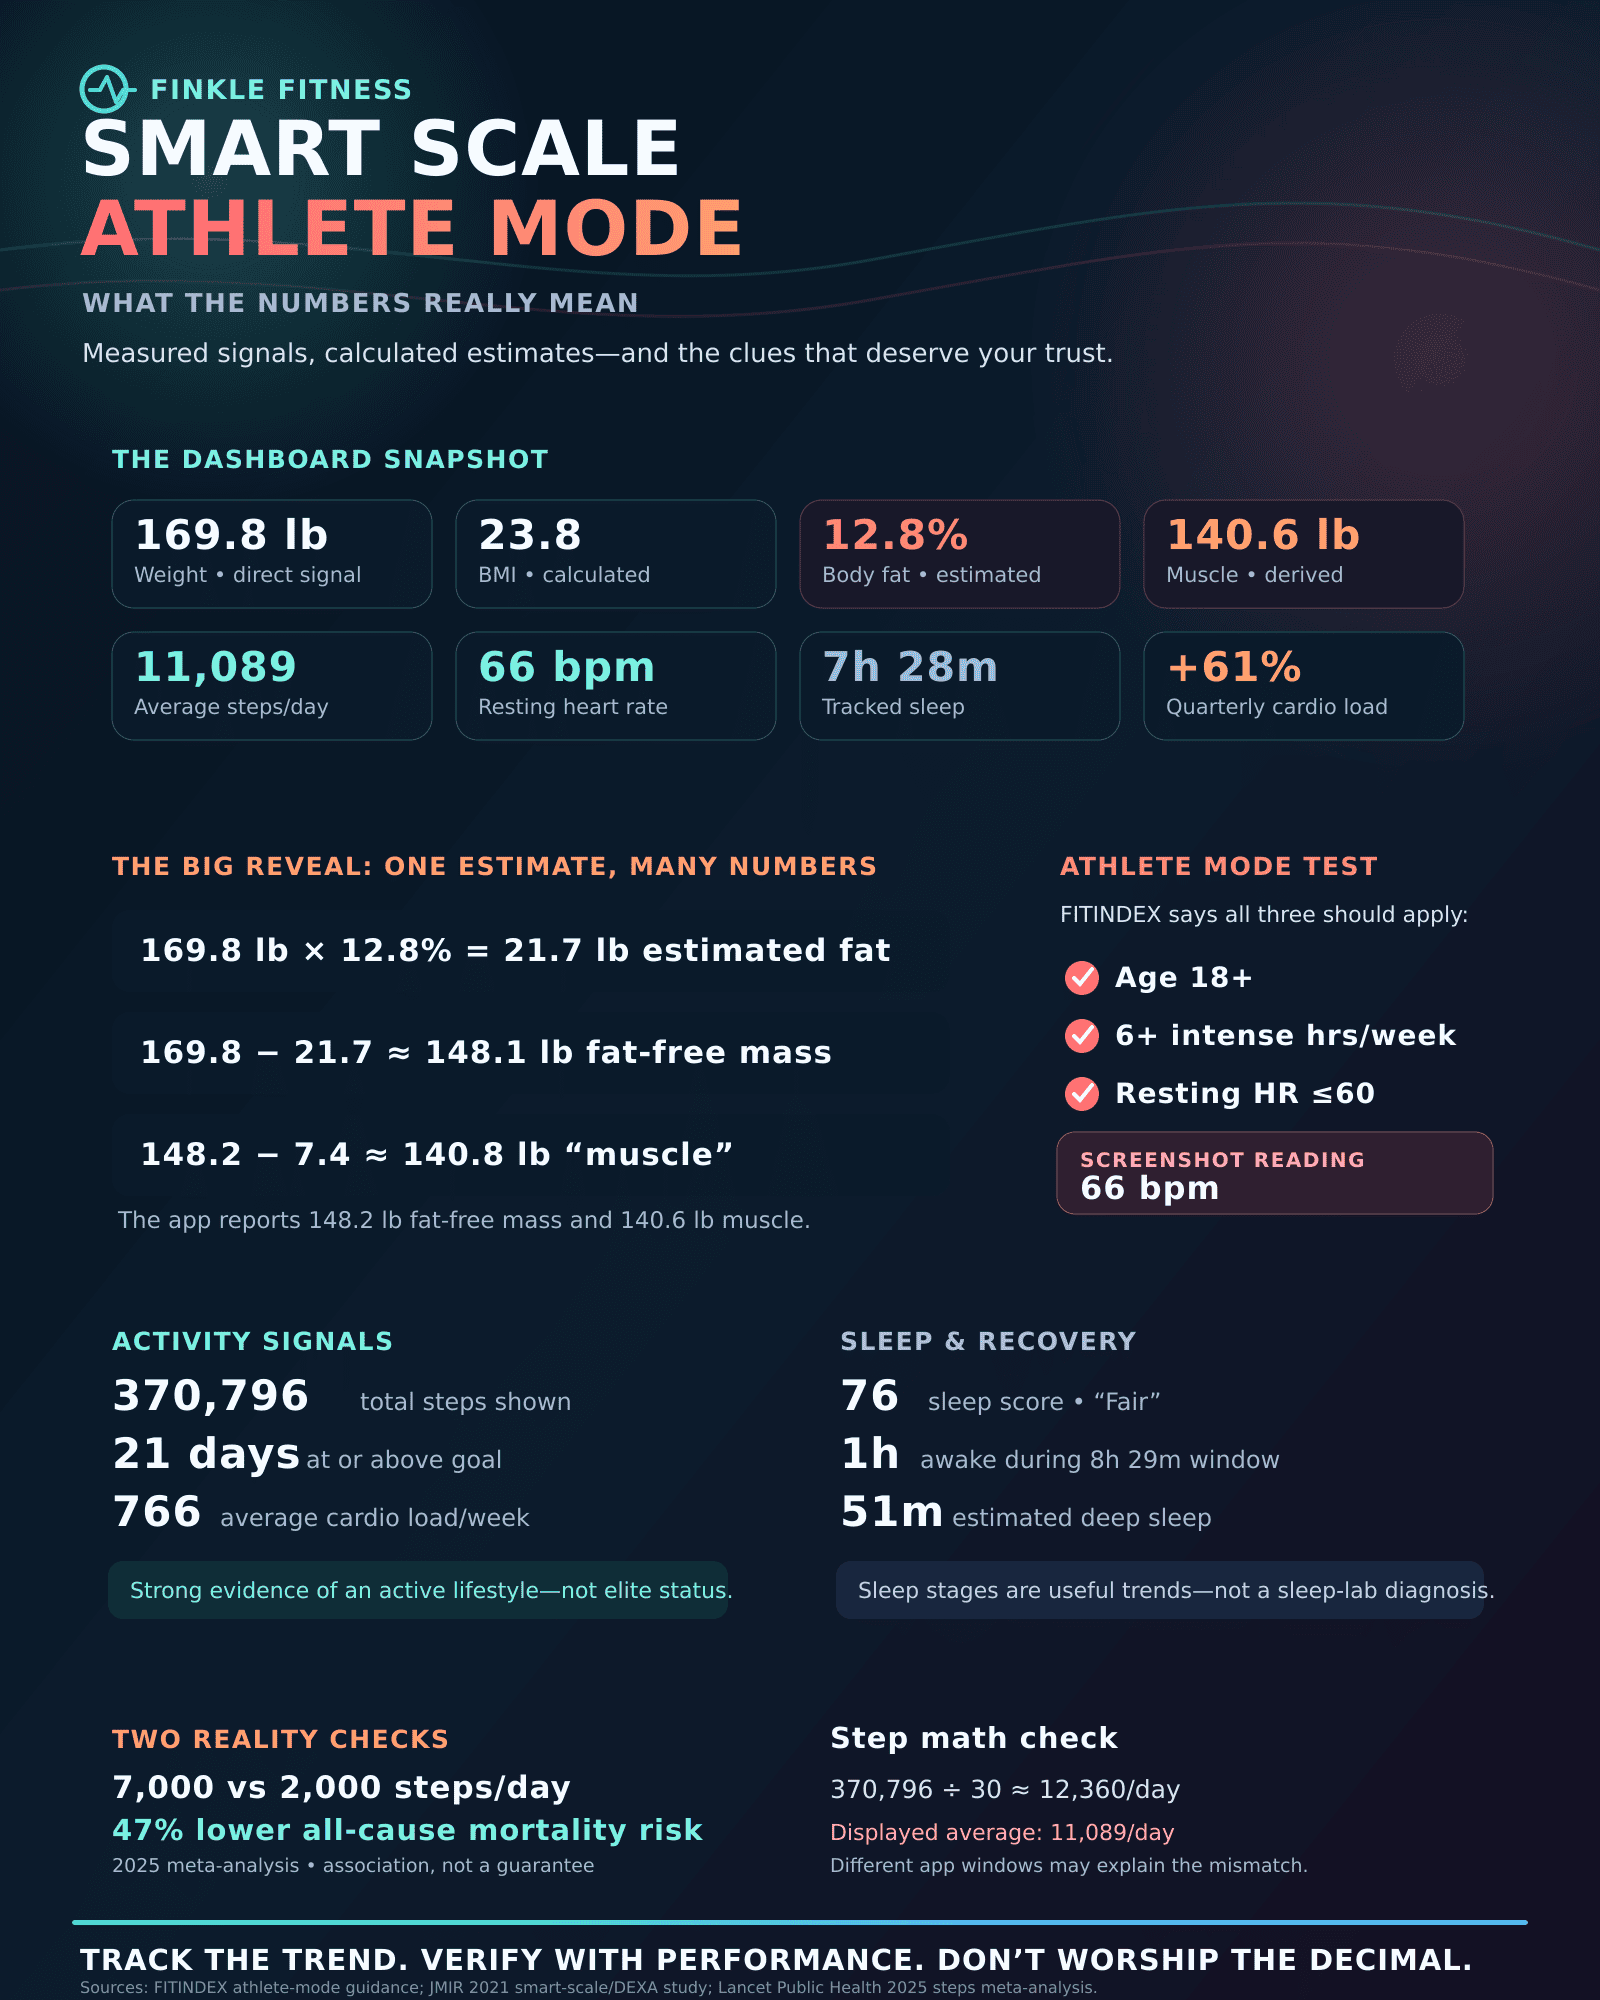
If 12.8% body fat were perfectly accurate, it would equal roughly 21.7 pounds of fat. Subtract that from 169.8 pounds and the result is approximately 148.1 pounds of fat-free mass—almost exactly the app’s displayed 148.2 pounds. That close match is not independent confirmation of the body-fat result. It reveals that fat-free mass is largely calculated from weight and estimated body-fat percentage.
The same thing happens with muscle mass. Subtract the displayed 7.4 pounds of bone from 148.2 pounds of fat-free mass and you get 140.8 pounds, almost identical to the reported 140.6 pounds of muscle. The app has not independently detected three different compartments that happen to fit together perfectly. It has divided the original estimate into mathematically related categories.
This matters because an error near the beginning flows into almost everything downstream. If athlete mode underestimates body fat, fat-free mass automatically rises, and estimated muscle mass rises with it. A 2021 study comparing three smart scales with DEXA found that the devices measured body weight reasonably well but were not accurate enough for body composition to replace clinical testing. The researchers found that all three scales underestimated fat mass, with the size of the error varying by device and individual (read the smart-scale accuracy study).
A body-fat reading of 12.8% would generally describe a lean adult man if it were accurate. It may be close, but the sensible interpretation is not “exactly 12.8%.” It is closer to “the scale’s current algorithm places me in a relatively lean range.” Photographs under consistent lighting, waist measurements, clothing fit, and longer-term scale trends can help determine whether that interpretation matches reality.
Water, Protein, Bone, and Visceral Fat
The 63% body-water reading is plausible for a lean, active man, but it is still an estimate produced by the same impedance signal. Hydration also affects the calculation itself, which creates a slightly circular situation: water status influences the measurement used to estimate water status. A salty meal, hard workout, alcohol, carbohydrate intake, dehydration, or simply weighing at a different time can shift several body-composition numbers without any real gain or loss of tissue.
The 19.9% protein figure does not describe dietary protein intake, protein absorption, or whether I ate enough protein that day. It is an estimated portion of body mass associated with lean tissue. Likewise, the 7.4-pound bone-mass number is not a bone-density test and cannot assess osteoporosis or fracture risk. Those numbers can add texture to a trend, but they should not be mistaken for direct examinations of bone or protein status.
A visceral-fat rating of 6 is another easily misunderstood figure. It is normally a manufacturer-specific index rather than six pounds, 6%, or a direct image of fat around the organs. A lower rating is generally preferable within the same app, but it is not interchangeable with another company’s scale or a clinical scan. Waist circumference and medical risk factors provide more context than the isolated score.
BMR and Metabolic Age
The estimated basal metabolic rate of 1,821 calories represents what the algorithm believes my body would burn over 24 hours at rest. It is not a daily calorie allowance because normal life also includes walking, digestion, exercise, chores, and other movement. Even a professionally measured resting metabolic rate can vary, while an app-generated BMR depends heavily on the profile information and estimated body composition. It is best used as a starting assumption, not a permission slip to eat an exact number of calories.
Metabolic age is even less concrete. The app is essentially comparing its estimated metabolism or body composition with reference values assigned to different ages. A metabolic age of 35 does not mean every organ, artery, joint, and cell in the body is biologically 35. It is a motivational comparison created by the app’s formula, and different devices can produce different “ages” for the same person.
What the Activity Numbers Reveal
The movement data makes the strongest case that I am genuinely active. An average of 11,089 steps per day is well above my displayed goal of 8,000, and I reportedly reached that goal on 21 days during the selected period. Steps do not capture lifting, cycling, swimming, workout difficulty, or running speed, but they do show that a meaningful amount of movement is built into my normal life. That matters whether or not the word “athlete” applies.
A 2025 systematic review and dose-response meta-analysis found that approximately 7,000 daily steps was associated with substantial health benefits compared with 2,000 steps, including a 47% lower risk of all-cause mortality. These were associations across populations rather than a guarantee for any individual, and benefits did not suddenly stop at 7,000. Still, the research suggests that an 11,000-step average is comfortably within an active range (view the daily-steps study).
Cardio load adds intensity to that movement story. The app reports an average weekly load of 766 from July through September and a 61% increase over the previous quarter. That probably reflects more running or harder cardiovascular training, but “61% more” sounds more impressive when the earlier baseline is not visible. A large percentage increase can represent serious progress, a very low starting point, or training that has become unevenly concentrated.
The graph’s peaks and valleys may be more useful than the headline percentage. If hard weeks are followed by soreness, declining pace, poor sleep, irritability, or heavy legs, the load may be increasing faster than recovery. If running pace improves while normal sessions feel easier and discomfort remains manageable, the increase is more likely producing productive adaptation. Performance and symptoms give the proprietary score its meaning—not the other way around.
Resting Heart Rate, Calories, and Missing HRV
A resting heart rate of 66 beats per minute is within the normal range for most adults and can be perfectly compatible with good recreational fitness. It is not unusually low for a trained endurance athlete, but one daily value cannot settle the question. Time of measurement, caffeine, stress, temperature, illness, hydration, sleep, and recent exercise can all influence heart rate. A consistent morning average over several weeks is far more useful than one screenshot.
The displayed 2,178 calories burned should also be treated as an approximation. Wearables infer energy expenditure from movement, heart rate, personal details, and proprietary equations; they do not directly watch calories leaving the body. The estimate may be useful for comparing an easy day with a hard day on the same device. It is less reliable as a reason to “eat back” exactly 2,178 calories or predict a precise change in body fat.
The missing HRV result is not necessarily a problem. Heart-rate variability is highly individual, and its value comes from comparing consistent overnight or morning measurements with a personal baseline. A single number would not prove excellent or poor recovery anyway. In some ways, “no data” is more honest than a confident score built from a weak signal.
The Athlete Mode Twist
Here is the most revealing detail in the entire dashboard: athlete mode is not an award the scale independently granted me. It is a profile setting that tells the scale which equations to use. FITINDEX says the mode intentionally lowers estimated fat mass and increases estimated muscle mass to better match athletic body types. That does not make the mode deceptive, but it makes choosing the correct mode essential.
According to FITINDEX’s own athlete-mode guidance, the setting is intended for adults who perform at least six hours of intense exercise per week and have a resting heart rate of 60 beats per minute or lower. The company describes normal mode as appropriate for everyone else, including fit people, dieters, and people gaining or losing weight. It also warns that using athlete mode incorrectly can produce erroneous body-composition data.
My screenshot shows a resting heart rate of 66. That does not automatically disqualify me because it is one current reading rather than a carefully measured baseline, and I would still need to assess whether I consistently complete six hours of intense weekly exercise. However, if my usual resting heart rate remains above 60 or much of my activity is moderate rather than intense, normal mode would probably be the more defensible setting under the manufacturer’s own rules.
A revealing experiment would be to take several standardized normal-mode readings and compare them with athlete-mode results. Weight should remain nearly identical, while body fat, muscle, water, and related estimates may shift simply because the equation changed. If the body did not change but the composition dashboard did, that demonstrates how much authority belongs to the algorithm rather than the electrodes.
The Dashboard Math That Does Not Quite Add Up
There is another intriguing problem in the step summary. The screen shows 370,796 total steps from August 16 through September 14, a span of 30 days if both dates are included. Dividing that total by 30 produces approximately 12,360 steps per day—not the displayed average of 11,089. Multiplying 11,089 by 30 gives 332,670, leaving a difference of more than 38,000 steps.
There may be an innocent technical explanation. The average and total could use different synchronization windows, include different devices, exclude incomplete days, or reflect data that updated at different times. The discrepancy does not erase the obvious conclusion that I move a lot, but it demonstrates why dashboard summaries should be checked before they become article headlines. Even apparently simple statistics may hide rules that the interface never explains.
How I Would Use These Numbers in Real Life
The solution is not to throw away the scale or stop tracking. These devices can be extremely useful when their numbers are assigned the right jobs. I would use the dashboard as an instrument panel for patterns, while allowing actual performance, appearance, health, and recovery to overrule any single score.
- Standardize weigh-ins. I would weigh under similar conditions—ideally in the morning, after using the bathroom, before eating or training, and with the scale in the same location. Weekly averages would matter more than isolated highs and lows.
- Verify athlete mode honestly. I would calculate actual hours of intense weekly training and examine a multiweek morning resting-heart-rate average. If I do not meet the manufacturer’s criteria, I would switch to normal mode and establish a fresh baseline.
- Track outcomes the devices cannot invent. Running pace, distance, perceived effort, strength, waist circumference, and workout consistency are more concrete than metabolic age. Improving a three-mile pace from roughly 10:45 toward 10:00 per mile is genuine evidence of progress.
- Judge body composition by trends. I would watch four- to eight-week movement in weight and waist measurements rather than reacting when body fat changes overnight. Rapid fluctuations are far more likely to be water and algorithm noise than newly gained muscle or fat.
- Treat recovery scores as prompts. A poor sleep score should encourage me to consider bedtime, soreness, stress, and how I feel—not convince me that 51 minutes of estimated deep sleep has ruined the day. Persistent fatigue or sleep problems deserve more attention than a single colorful chart.
The most revealing test is whether the statistics agree with one another over time. If running pace improves, normal workouts feel easier, resting heart rate trends down, and sleep remains stable, the training is probably working. If the scale reports more muscle while strength falls and the waist expands, the flattering calculation deserves less trust. Triangulation turns imperfect devices into a useful system.
Why This Matters Now
Fitness tracking has moved far beyond counting steps. Consumer devices increasingly assign readiness scores, cardio loads, stress levels, biological ages, sleep stages, and detailed body compartments. The more polished these dashboards become, the easier it is to forget that many outputs are interpretations rather than observations. A person can end up optimizing a score without improving the quality it supposedly represents.
That can affect training decisions. Someone may undereat because an estimated calorie number seems exact, overtrain to satisfy a cardio target, or panic when hydration makes body fat jump overnight. Another person may ignore obvious progress because the app withheld an impressive label. The healthiest relationship with fitness technology is neither blind trust nor automatic rejection—it is informed skepticism.
Final Verdict: Do These Numbers Describe an Athlete?
The available evidence describes a lean, highly active recreational exerciser with meaningful cardiovascular activity. Averaging around 11,000 steps, increasing cardio training, working to improve a three-mile pace, maintaining a BMI of 23.8, and recording a resting heart rate of 66 create a stronger case than the word “athlete” printed inside an app. These are positive numbers, and the overall pattern looks healthier and more active than average.
The dashboard does not prove that body fat is exactly 12.8%, muscle mass is exactly 140.6 pounds, or the body has a metabolic age of 35. Several of those statistics are mathematically dependent, and athlete mode may be pushing the estimates toward lower fat and higher muscle. The sleep stages and calories are useful approximations, while the unexplained step discrepancy is a reminder to check even basic summaries. Confidence should be highest in the trends that can be confirmed through performance and repeated measurements.
So, does my smart scale say I am an athlete? Yes—but mainly because athlete mode tells it to interpret me through an athletic equation. Do my actual habits suggest that I am athletic? The activity level, running progress, and training load make a reasonable case for an active recreational athlete, although not necessarily the specialized “hardcore athlete” profile the scale manufacturer describes. The label is debatable, but the progress is real—and ultimately, improving what my body can do matters far more than persuading an algorithm to admire it.